15+ B2B Ecommerce Metrics That Have Real Impact in 2025
In 2025, understanding and acting on the right metrics determines competitive advantage for B2B companies. Tracking key performance indicators (KPIs) allows marketing, sales, operations, and finance teams to align decisions, optimize processes, and maximize revenue.
This guide explores high-impact B2B ecommerce metrics, explains why they matter, shows how to measure them, and demonstrates how to integrate them into a strategic measurement framework.
Why Tracking B2B Ecommerce Metrics Is Crucial
B2B ecommerce is evolving. In the past, companies primarily tracked transactional volume, such as the number of orders, website visits, or leads generated. Today, businesses place greater emphasis on metrics that reflect quality, loyalty, and profitability, including customer lifetime value, retention, and gross margin.
Several market trends illustrate this shift:
- Digital transformation in B2B: Ecommerce platforms offer accelerated workflow and data-driven solutions such as B2B on Shopify or Adobe Commerce.
- Emphasis on long-term relationships: According to the Institute for Supply Management (ISM), repeat purchases and strong vendor relationships improve supply chain stability and reduce operational risk source
- Rising customer expectations: Modern B2B buyers research independently before engaging sales teams. Reports show that most of the buyer journey occurs digitally, making it essential to prioritize metrics that reflect meaningful engagement rather than volume alone source
As a B2B ecommerce solution provider, your business revolves around more than just selling your services. Focusing on impactful, high-quality metrics, businesses can improve customer experience, strengthen loyalty, and drive sustainable revenue growth.
15+ B2B Ecommerce Metrics with Real Impact in 2025
B2B marketing metrics & KPIs are most actionable when grouped logically. One effective approach follows the customer journey, from awareness to retention.
Awareness & Visibility Metrics
These metrics measure how visible your brand is to potential buyers:
1. Website Traffic
Website traffic measures how many users visit your B2B ecommerce site. Tracking traffic is essential because B2B buyers now spend much of their research time online, comparing products, reading content, and evaluating suppliers before contacting sales teams.
Core KPIs to monitor:
- Visits: Each instance a user enters your website.
- Session duration: Average time visitors spend on your website per session.
- Bounce rate: Percentage of visitors who leave after viewing a single page.
- Traffic source: Indicates the origin of traffic (organic search, paid ads, referral sites, email campaigns).
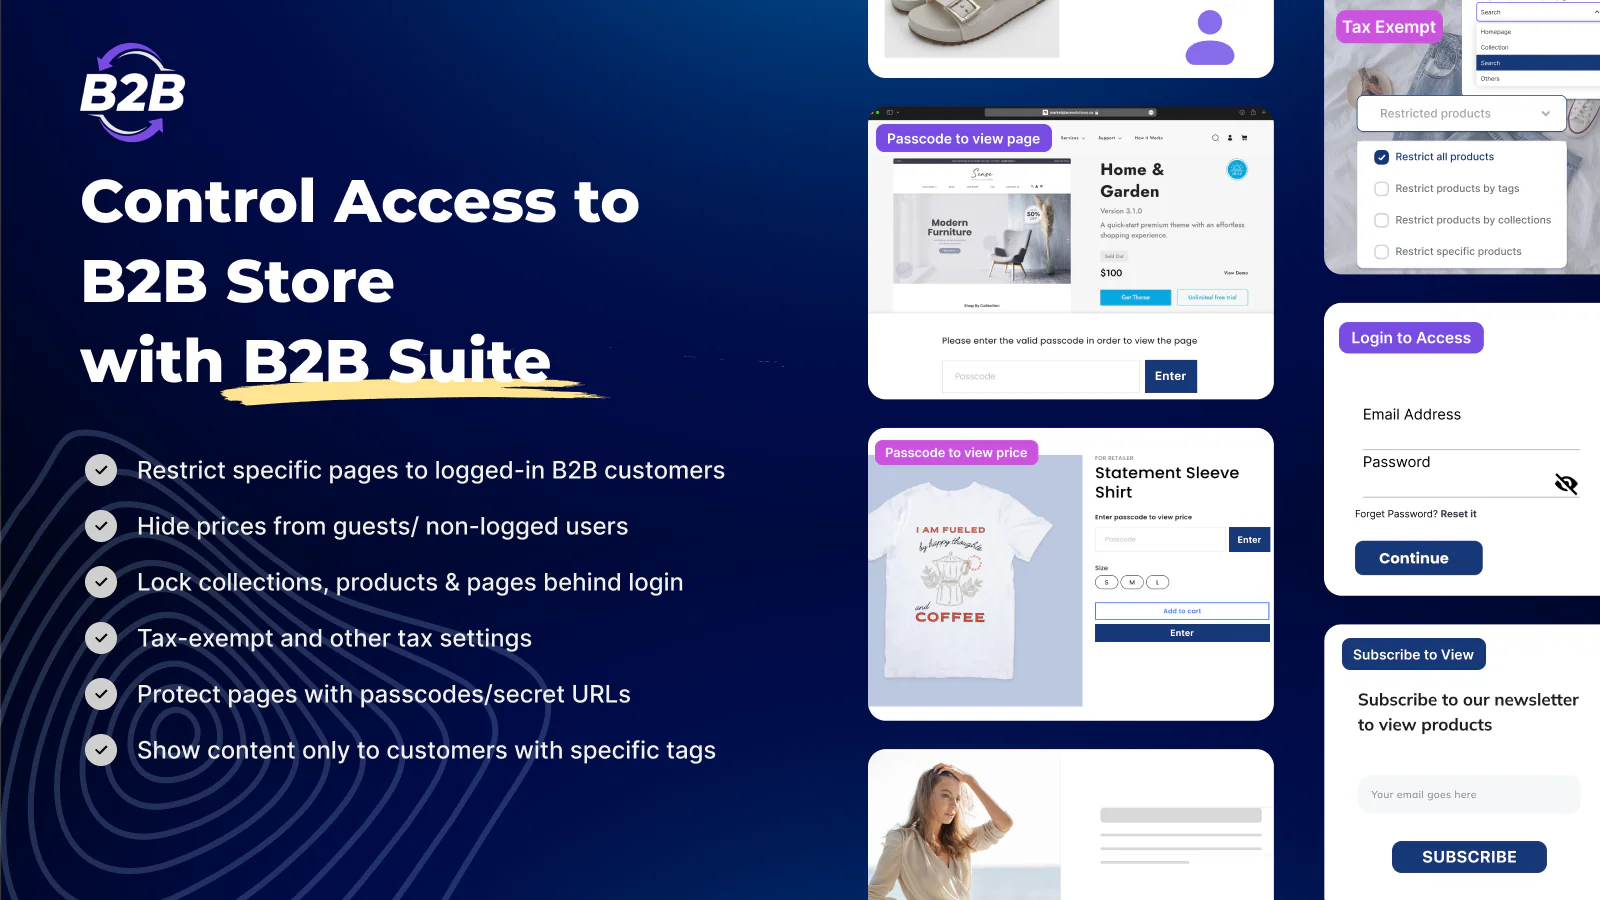
Make sure your website have all the essential B2B features.
2. Search Rankings
Search rankings track where your website appears in search engine results for target keywords.
Higher rankings translate to more qualified traffic at a lower cost than paid campaigns. Tracking rankings helps identify which keywords and pages are performing well and where SEO improvements are needed.
3. Content Marketing Engagement
Content marketing engagement measures how audiences interact with digital assets such as blogs, guides, videos, or downloadable reports. Engagement signals authority, trustworthiness, and relevance, positioning your company as a reliable solution provider.
When people interact with your content — like commenting on a post or clicking a call-to-action — they are showing interest in the topic, which could indicate they are potential marketing-qualified leads.

Lead Generation & Qualification Metrics
This group evaluates how effectively marketing converts interest into opportunities:
4. Marketing Qualified Leads (MQLs)
A Marketing Qualified Lead (MQL) is a potential business customer who has shown interest in your products or services through specific actions, such as downloading a white paper, signing up for a webinar, or submitting a contact form.
MQLs indicate the effectiveness of marketing campaigns in attracting prospects worth nurturing. They help marketing teams prioritize leads likely to convert into sales opportunities.
5. Sales Qualified Leads (SQLs)
A Sales Qualified Lead (SQL) is an MQL that has been vetted by the sales team and is considered ready for direct engagement. These leads show strong buying intent and a higher likelihood of closing. SQLs help sales teams focus on opportunities with real revenue potential, improving efficiency and pipeline predictability.
6. Cost per Lead (CPL)
Cost per Lead measures the marketing investment required to generate a single lead. It includes campaign spend, content production, and tools used to capture leads. Tracking CPL ensures that marketing spend aligns with lead quality. A low CPL is beneficial only if the leads are likely to convert.
Formula:
CPL = Total marketing spend/ Number of leads acquired
7. Lead-to-Conversion Rate
This metric tracks the percentage of leads that become paying customers. It reflects lead quality, marketing-sales alignment, and effectiveness of the sales process.
High lead-to-conversion rates indicate strong targeting and qualification practices. Low rates suggest misalignment between marketing campaigns and sales readiness or insufficient nurturing.
Formula:
Lead-to-Conversion Rate=Number of converted leads/Total leads×100

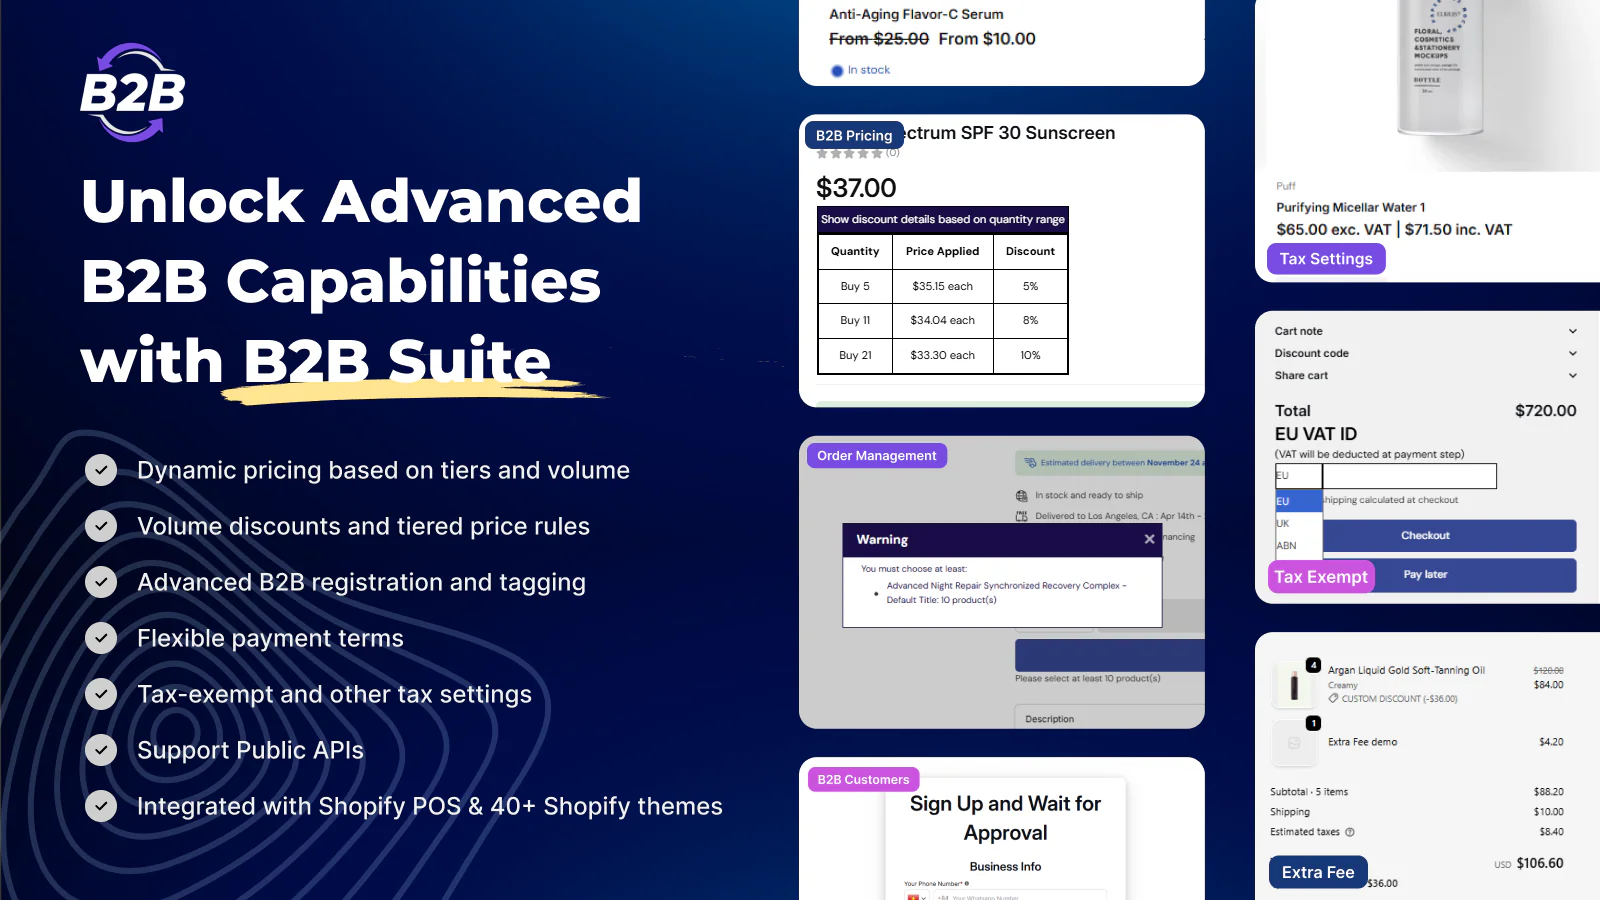
Tips: If you are on Shopify, use BSS: B2B & Wholesale Solution to boost your conversion rate with quantity breaks, custom pricing, B2B registration forms, B2B tax and more.
Financial & Sales Metrics
Financial and sales metrics show how profitable and efficient your sales process is:
8. Customer Acquisition Cost (CAC)
Customer Acquisition Cost measures the total investment required to acquire a new customer. This includes marketing spend, sales team efforts, software tools, and any other expenses related to attracting and converting leads.
A high CAC relative to customer lifetime value can signal unsustainable growth, while a low CAC indicates cost-effective customer acquisition. Implementing targeted content marketing strategies can help reduce CAC, resulting in a larger customer base. Once you’re bringing more B2B customers to your business website, you can use an AI conversational platform to engage with visitors and find potential leads.
Related metrics to monitor:
- CAC by channel: Breaks down cost for each marketing or sales channel (email, paid ads, events).
- CAC vs. CLTV ratio: Compares acquisition cost against expected lifetime revenue from the customer.
Formula:
CAC = Total acquisition expenses / Number of new customers acquired
9. Gross Margin per Order
Gross Margin measures profitability per transaction. It shows how much revenue remains after deducting the cost of goods sold (COGS).
Tracking gross margin ensures sales growth translates into real financial gain. Businesses can identify high- and low-margin products, optimize pricing, and improve profitability.
Formula:
Gross Margin % = (Revenue − COGS) / Revenue × 100
10. Sales Cycle Length
Sales Cycle Length measures the average time from lead identification to deal closure. Shorter cycles reduce operational costs, improve cash flow, and increase the number of deals completed over time. Understanding sales cycle length also helps forecast revenue and resource allocation.
11. Inventory Turnover
Inventory Turnover calculates how quickly inventory sells and is replaced over a period.
High turnover indicates efficient operations and strong demand. Low turnover can signal overstocking, slow-moving items, or outdated inventory, which increases carrying costs.
Formula:
Inventory Turnover = Cost of Goods Sold / Average Inventory

Purchase Intent & Customer Retention Metrics
These metrics gauge buyer behavior and loyalty after initial engagement:
12. Customer Retention Rate
Customer Retention Rate measures the percentage of buyers who continue purchasing within a specific period. High retention indicates customer satisfaction, loyalty, and effective post-purchase engagement.
Retaining existing customers costs less than acquiring new ones. Any business needs loyal customers for true brand reputation and stability. Businesses that track retention can identify loyal segments and implement strategies to reduce churn.
Formula:
Retention Rate = (Number of customers at end of period − New customers during period) / Number of customers at start of period × 100
Tips: If your CRR is low, you may have issues with your customer services. Using AI in customer service can help your business provide quick and accurate responses to customer queries to reduce your response time and better satisfy B2B customers.
13. Average Order Value (AOV)
Average Order Value measures the typical revenue generated per transaction. Increasing AOV allows businesses to boost revenue without acquiring new customers. Strategies like upselling, cross-selling, or product bundling can help raise the value of each order.
Key KPIs to monitor:
- AOV by customer segment: Reveals which groups spend more per order.
- AOV trends over time: Shows whether average spend is increasing or decreasing.
Formula:
AOV = Total revenue / Number of orders
14. Customer Lifetime Value (CLV)
Customer Lifetime Value estimates the total revenue a customer generates across the entire relationship with your business.
High CLV indicates customer loyalty and recurring revenue potential. It also guides decisions on retention strategies such as your B2B loyalty program.
Formula (simplified):
CLV = Average Order Value × Purchase Frequency × Customer Lifespan
Tips: A low CLV can be caused by consistently negative experiences with your B2B business. Poor customer service or a complicated contact process will all directly impact your customer’s experience. Check your call center agent efficiency and ensure your B2B business is readily available to answer any customer questions.
15. Churn Rate
Churn Rate measures the percentage of customers who stop purchasing over a defined period. Monitoring churn prevents revenue loss and highlights retention issues. High churn can indicate dissatisfaction, poor product-market fit, or ineffective customer engagement.
Key KPIs to monitor:
- Customer churn rate: Percentage of lost customers.
- Revenue churn: Lost revenue due to customer attrition.
Formula:
Churn Rate = Customers lost during period / Customers at start of period × 100
16. Shopping Cart Abandonment Rate
Shopping Cart Abandonment Rate measures the percentage of buyers who add items to the cart but do not complete the purchase.
High abandonment rates highlight friction in checkout processes, pricing concerns, or delivery issues. Reducing abandonment improves conversion rates and overall revenue.
Key KPIs to monitor:
- Abandonment rate by device: Mobile vs desktop performance.
- Abandonment by step: Identify checkout stages causing drop-offs.
- Recovery rate: Percentage of abandoned carts recovered through follow-up emails or retargeting.
Formula:
Abandonment Rate = Abandoned carts / Total initiated carts × 100
FAQs about B2B Marketing Metrics
What differs between B2B and B2C ecommerce metrics?
B2B metrics differ due to complexity, deal size, and buyer behavior:
– Volume vs Value: B2B focuses on fewer, higher-value transactions. B2C often emphasizes higher volume.
– Sales cycle length: Longer in B2B, requiring metrics like quote-to-order rate.
– Decision complexity: B2B involves multiple stakeholders, making MQL → SQL → Lead-to-Conversion tracking critical.
How often should B2B companies revisit metric targets?
Depends on maturity and growth stage. Quarterly or semi-annual reviews are recommended. Fast-growing or digital-first companies may review monthly for operational metrics.
Is it okay to use AI or automation to calculate or predict metrics?
Yes, AI enhances forecasting, anomaly detection, and lead scoring. Transparency remains essential. Teams must understand how models produce predictions and maintain oversight.
What are warning signs that metrics aren’t aligned with real business impact?
There are several signs:
– Revenue rising but margins declining
– Website traffic increasing but MQLs dropping
– High customer acquisition but low retention
– Growth in users but rising churn
If these patterns appear, deeper analysis is necessary to ensure metrics reflect meaningful performance.
Conclusion
B2B ecommerce in 2025 requires organizations to prioritize high-impact metrics across acquisition, engagement, sales, and retention. Metrics serve as both compass and performance gauge. Businesses that track the right indicators, align them with strategic goals, and iterate continuously will achieve sustained growth, efficiency, and stronger customer relationships.
Metrics only have value when interpreted correctly. Investing time in building dashboards, reviewing results, and testing improvements ensures your metrics drive decisions, not just reports.

Finn Nguyen
Finn is a Shopify expert with 5+ years of experience helping new business owners launch and grow online stores. Specializing in store setup, theme selection, and optimization, he provides practical guidance to turn ideas into successful eCommerce businesses